Wednesday, 20 June 2012

Ontario Electricity Generation on a Hot Day

Today is a hot day in Toronto. The temperature is 34 degrees and it is only 2 pm. Toronto's Medical Officer has upgraded the heat alert to an extreme heat alert. Cities across the province are finding it very hot as well.
On hot days like today, demand for air conditioning swells. Air conditioning requires electricity, so what fuel sources are being used to generate electricity?


Source MW %
Nuclear 10857 45.31
Hydro 4658 19.44
Gas 5410 22.58
Coal 1722 7.19
Wind 441 1.84
Other 873 3.64


Total 23961 100
source:http://www.ieso.ca/
Fuels used to meet demand Jun. 20 - 12:00-13:00

Nuclear is the most important fuel. Nuclear, hydro and natural gas provide 87.3% of the fuel. Other refers to wood waste, biogas, solar, etc. Electricity generation in Ontario is very dependent on nuclear. For the year to date, nuclear has accounted for 56.9% of the fuel used to generate electricity in Ontario. Renewables make up a relatively small proportion of total fuel source. Notice that coal, which used to be a big fuel source, now accounts for just 2.7% of total fuel usage.


Today's electricity demand is projected to peak is 24,267 MW at 5 pm.
The summer record was 27,005 MW on August 1, 2006.

Sunday, 10 June 2012

Sustainable Investing vs Wine and Gold

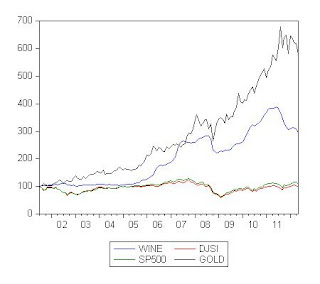
What do sustainable investments, wine and gold have in common over the past ten years? Well, for one thing, investments in wine and gold have vastly outperformed an investment in sustainable companies.Below is a chart showing the performance of wine (measured by the Live Ex Fine Wine 100 Index), sustainable equities (as measured by the Dow Jones Sustainability Index), gold (the front month futures contract on COMEX gold), and the S&P500.


Sharpe ratios show that wine has been the best investment followed closely by gold. The S&P 500 has a slightly larger Sharpe ratio then the Dow Jones Sustainability Index, but both Sharpe ratios are negative over the sample period.


wine djsi sp500 gold
0.79 -0.12 -0.06 0.78

To combine the concepts of sustainability and wine together, how about a sustainability wine index? An example of this would be an index that follows organic wines. 


Friday, 8 June 2012

CAPE Values for April 2012

I am a  follower of Robert Shiller's cyclically adjusted p/e ratio (CAPE). The CAPE seems to work reasonably well for the US and I am always interested in what CAPEs look like for other countries. To date, however, Mebane Faber is the only person that I am aware of that does this type of calculation for other countries.I have taken the data  from his recent post and ranked the countries according to CAPE. Italy, Spain, Netherlands and Belgium all have CAPE values below 10. Notice these are all European countries. Canada and the US have high CAPE values.


Country Value
Italy 7.34
Spain 8.33
Netherlands 9.4
Belgium 9.62
Russia 10.24
France 10.98
Austria 11.06
China 12.88
UK 13.24
Singapore 13.27
Germany 13.7
Australia 14.01
Turkey 14.65
Switzerland 14.67
Japan 15.2
Sweden 15.21
Brazil 15.77
Taiwan 16
Hong Kong 16.05
Thailand 16.34
South Africa 17.44
Korea 18.62
Canada 18.86
India 20.06
Mexico 21.69
USA 21.76
Malaysia 23.12
Chile 26.4
Indonesia 29.41
source: http://www.mebanefaber.com/2012/05/24/global-shiller-capes/

Tuesday, 5 June 2012

How Green is Boston?

This week I am making my travel arrangements for the Academy of Management Meetings in Boston. Whenever I travel to a major city I like to have an idea of how green the city is. The Economist Intelligence Unit in sponsorship with Siemens has created the US and Canada Green City Index. In constructing this index, 27 Canadian and US cities are ranked on categories like CO2 emissions, energy use, land use, buildings, transport, water usage, waste, air pollution and environmental governance. Boston ranks 6 on the Green City Index (higher than the city where I work, Toronto). Boston is the greenest city that the AOM has been to in many years. San Fransisco ranks as the greenest city while Detroit ranks 27 th.


The Green City Index is based on a city's ranking in several categories. Boston's ranking in the categories are: CO2 emissions (11), energy use (2), land use (4), buildings (10), transport (17), water usage (2), waste (15), air pollution (14), and environmental governance (15). Boston does particular well in the categories of energy use, land use and water use. Boston's low carbon dioxide emissions are helped by consuming less energy and using less coal in electricity generation. Boston also has a comprehensive plan for energy conservation initiatives and the Solar Boston project which aims to encourage wide-spread adoption of solar energy. At just 74 gallons of water per person per day, Boston has the second lowest level of water consumption of the cities ranked (New York has the lowest water consumption). Boston is a high density city which gives it a high ranking on the land use scale.

Green buildings, transport and air pollution are areas where Boston could do better. Boston has 6.5 buildings per 100,000 people that are LEED certified. This is about average. Boston has a relatively high rate of non-automobile commuting but the city's public transport options are limited. More public transport in more places would help to improve Boston's transportation ranking. Boston could also improve on recycling, especially the recycling of hazardous material. Boston's low ranking on environmental governance has to do with the fact that there is no coherent action plan for green initiatives but rather a series of advisory plans.