Google searches of the term "renewable energy" peaked in March of 2009. Since then, Google searches for renewable energy having been trending downwards. In comparison, searches of the term "fracking" really started to take off in late 2010 and hit a record high in February of this year.
Here is a regional map of searches for renewable energy. Searchers in Europe, Africa, India, and Australia have shown strong interest in renewable energy.
Here is a regional map of searches for fracking. Notice how much search interest there is in this term coming from the US and South Africa.
Showing posts with label renewables. Show all posts
Showing posts with label renewables. Show all posts
Friday, 19 April 2013
Thursday, 21 February 2013
Renewable Energy in the US
Below is a link to a good video showing how the US is moving forward with renewable energy. Here are some of the highlights.
A combination of federal and state rebates and tax incentives are providing strong incentives to adopt renewable energy. In Washington State, for example, home owners who install solar panels can expect a payback period of between 5 and 7 years.
Jobs in the US solar industry increased 13% last year, compared to just 2% for the overall economy.
In Texas, 1/4 of all electricity produced comes from wind farms.
The US outspends Canada 18 to 1 on per capita spending on clean tech.
The video also features Itek, a US solar manufacturer run by a Canadian.
Friday, 8 February 2013
Renewable Energy Moving Forward
The Pew Charitable Trusts recently published a research report on the state of renewable energy. They are predicting that global revenue from the installation of renewable energy
technologies would grow at a
compound annual rate of eight per cent from $200bn in 2012 to $327bn by
2018. This would create cumulative revenue of $1.9tr. The compound annual rate of 8% is consistent with other projections (eg. IEA). In general, most analysis shows that renewable energy usage is the fastest growing component of the energy mix.
The Pew report points out that while there are tremendous opportunities for countries to profit from this trend in renewable energy investment, countries without a well formulated energy policy are likely to lose out. The report highlights the case in the US but this equally applies to Canada. There are 118 countries with renewable energy targets. Unfortunately, neither Canada or the US is among them.
Here are a few interesting figures from the Pew report showing that G20 countries are leading the way in clean energy investment and how the cost of solar energy modules has fallen dramatically.


In order to get an idea of how renewable energy depends upon income and CO2 emissions, I gathered some data on world energy consumption, CO2 emissions, GDP, and renewable energy production from the World Bank on line database.Renewable energy includes biomass, wood waste, geothermal, solar, wind, tide, wave, etc. but excludes hydroelectric power.
The units for my variables are:
energy is measured in millions of kt of oil equivalent
renewable energy is measured as electricity production from renewable sources, excluding hydroelectric (billions of kWh)
CO2 is measured in millions of kt of carbon dioxide emissions
GDP is measured in trillions of 2005 international dollars
Looking at year over year % changes indicates that energy use, GDP, and CO2 emissions track each other very closely. Notice that renewable energy tends to have much greater fluctuations.

Here is how renewable energy correlates with CO2 emissions. Both variables are measured in natural logarithms.
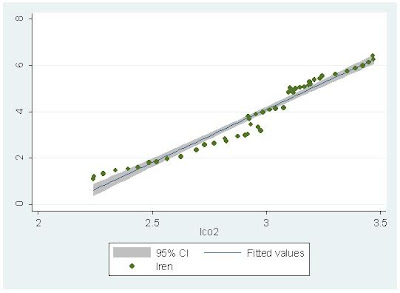
Along the best fit line, a 1% increase in CO2 emissions is associated with a 4.59% increase in renewable energy.
Here is how renewable energy correlates with GDP. Both variables are measured in natural logarithms.

Along the best fit line, a 1% increase in GDP is associated with a 2.99% increase in renewable energy. The high income elasticity is consistent with some of my previous research on renewable energy consumption in developed and emerging economies (here, here).
By comparison, a 1% increase in GDP is associated with a 0.58% increase in total energy consumption.

As the world economy rebounds from the Great Recession, economic activity will increase and GDP will increase. Increases in GDP have a bigger impact on renewable energy consumption than total energy consumption, so expect to see further increases in renewable energy in the future. Unfortunately, without a reasonable energy policy, Canada and the US will be left on the sidelines as other countries capture competitive advantage in the renewable energy sector.
Wednesday, 20 June 2012
Ontario Electricity Generation on a Hot Day
Today is a hot day in Toronto. The temperature is 34 degrees and it is only 2 pm. Toronto's Medical Officer has upgraded the heat alert to an extreme heat alert. Cities across the province are finding it very hot as well.
On hot days like today, demand for air conditioning swells. Air conditioning requires electricity, so what fuel sources are being used to generate electricity?
Nuclear is the most important fuel. Nuclear, hydro and natural gas provide 87.3% of the fuel. Other refers to wood waste, biogas, solar, etc. Electricity generation in Ontario is very dependent on nuclear. For the year to date, nuclear has accounted for 56.9% of the fuel used to generate electricity in Ontario. Renewables make up a relatively small proportion of total fuel source. Notice that coal, which used to be a big fuel source, now accounts for just 2.7% of total fuel usage.

Today's electricity demand is projected to peak is 24,267 MW at 5 pm.
The summer record was 27,005 MW on August 1, 2006.
On hot days like today, demand for air conditioning swells. Air conditioning requires electricity, so what fuel sources are being used to generate electricity?
| Source | MW | % |
| Nuclear | 10857 | 45.31 |
| Hydro | 4658 | 19.44 |
| Gas | 5410 | 22.58 |
| Coal | 1722 | 7.19 |
| Wind | 441 | 1.84 |
| Other | 873 | 3.64 |
| Total | 23961 | 100 |
| source:http://www.ieso.ca/ | ||
| Fuels used to meet demand Jun. 20 - 12:00-13:00 | ||
Nuclear is the most important fuel. Nuclear, hydro and natural gas provide 87.3% of the fuel. Other refers to wood waste, biogas, solar, etc. Electricity generation in Ontario is very dependent on nuclear. For the year to date, nuclear has accounted for 56.9% of the fuel used to generate electricity in Ontario. Renewables make up a relatively small proportion of total fuel source. Notice that coal, which used to be a big fuel source, now accounts for just 2.7% of total fuel usage.
Today's electricity demand is projected to peak is 24,267 MW at 5 pm.
The summer record was 27,005 MW on August 1, 2006.
Tuesday, 8 May 2012
Failing US clean tech policy
A disturbing new report from the Metropolitan Policy Program at Brookings, shows how US federal support for clean tech is expected to drop by 75% between 2009 and 2014. This crash scenario is based on the assumption that 62 clean tech support programs currently in place will expire and nothing will replace them. The the American Recovery and Reinvestment Act of 2009 (ARRA) provided a number of initiatives to support clean tech but these initiatives are now coming to an end. A number of additional tax credits and production support policies for clean tech are also now coming to an end. In addition, the boom in natural gas is also having an impact. Natural gas is the marginal fuel source for power generators. With natural gas prices currently between $2 and $3 MMBTUs there is no incentive to invest in large scale renewable projects like wind. For wind projects to be economically viable, natural gas prices need to be around $6 MMBTUs.

Clean tech is a very difficult market space to invest in and make money. The macro drivers of clean tech include climate change, energy security, resource depletion, new technology and green consumers. Government policy can greatly influence these drivers. Climate change seems to be a difficult concept for Washington to address so an energy security argument might be easier. In 2011, US net petroleum imports equaled 8.4 MMbd. Assuming an oil price of $100 per barrel, US net imports totaled $306 billion dollars in 2011. The US Department of Commerce has some interesting charts on how the oil import bill breaks down by household. Using some of this money spent on imported oil to invest in renewable energy seems like a good way to increase US energy security and reduce the dependence on imported oil. The US needs a coherent federal energy policy to address issues like energy security and renewable energy should be part of such policy.

Clean tech is a very difficult market space to invest in and make money. The macro drivers of clean tech include climate change, energy security, resource depletion, new technology and green consumers. Government policy can greatly influence these drivers. Climate change seems to be a difficult concept for Washington to address so an energy security argument might be easier. In 2011, US net petroleum imports equaled 8.4 MMbd. Assuming an oil price of $100 per barrel, US net imports totaled $306 billion dollars in 2011. The US Department of Commerce has some interesting charts on how the oil import bill breaks down by household. Using some of this money spent on imported oil to invest in renewable energy seems like a good way to increase US energy security and reduce the dependence on imported oil. The US needs a coherent federal energy policy to address issues like energy security and renewable energy should be part of such policy.
Friday, 27 January 2012
BP's World Energy Projections to 2030
BP recently released their most recent Energy Outlook 2030. This is an interesting document with lots of useful information on what energy trends are likely to look like between 2010 and 2030.
"This Energy Outlook contains our projections of future energy trends and key
uncertainties, based on our views of the evolution of the world economy, of policy, and
technology."
Income growth and population growth are the two primary drivers of energy use. Primary energy consumption is expected to grow by 1.6% per year to 2030.This is slower than the 2.0% per annum (p.a.)growth rate that was observed over the past 20 years. World electricity demand is expected to grow by 2.6% p.a. over the same period. Some emerging countries are going to have difficulty meeting the demand for electricity. The energy mix in 2030 will still be dominated by fossil fuels although oil's share of world energy mix will decline. Oil is expected to be the slowest growing fuel over the next 20 years. Natural gas is expected to be the fastest growing fossil fuel (2.1% p.a.). Almost all of the growth (96%) in energy demand is expected to come from non-OECD countries. The fastest growing segment is for renewables (including biofuels) and they are expected to to grow at 8.2% per year between 2010 and 2030. The 8.2% p.a. is very close to my own calculation of 8.5% p.a.although I did not include biofuels in my calculation.

Energy intensities are expected to converge due to energy trade and energy efficiency.

Renewables are expected to play a greater role in electricity generation.

In 2030, Canada will be pumping 2.2 Mb/d more oil from the Alberta tar sands than the 1.3 Mb/d they do today. Oil supply from non-conventional oil (tar sands, shale oil, etc.) will grow but still be a relatively small amount when compared to conventional oil sources. Global demand for oil is projected to be around 103 Mb/d in 2030. Conventional oil supply is expected to meet the vast majority of this demand. What is not clear is where the oil will come from. The expectation seems to be that Iran, Iraq, Russia, and Saudi Arabia will be pumping a lot more oil in 2030 than they do today.
CO2 emissions, however, continue to rise.

BP's projections are in the mid range of most publicly available energy demand forecasts. For 2030, the IEA is projecting global oil demand around 100 Mb/d, the US EIA is projecting oil demand around 111 Mb/d and my own projections are for global oil demand around 117 Mb/d.
"This Energy Outlook contains our projections of future energy trends and key
uncertainties, based on our views of the evolution of the world economy, of policy, and
technology."
Income growth and population growth are the two primary drivers of energy use. Primary energy consumption is expected to grow by 1.6% per year to 2030.This is slower than the 2.0% per annum (p.a.)growth rate that was observed over the past 20 years. World electricity demand is expected to grow by 2.6% p.a. over the same period. Some emerging countries are going to have difficulty meeting the demand for electricity. The energy mix in 2030 will still be dominated by fossil fuels although oil's share of world energy mix will decline. Oil is expected to be the slowest growing fuel over the next 20 years. Natural gas is expected to be the fastest growing fossil fuel (2.1% p.a.). Almost all of the growth (96%) in energy demand is expected to come from non-OECD countries. The fastest growing segment is for renewables (including biofuels) and they are expected to to grow at 8.2% per year between 2010 and 2030. The 8.2% p.a. is very close to my own calculation of 8.5% p.a.although I did not include biofuels in my calculation.
Energy intensities are expected to converge due to energy trade and energy efficiency.

Renewables are expected to play a greater role in electricity generation.

In 2030, Canada will be pumping 2.2 Mb/d more oil from the Alberta tar sands than the 1.3 Mb/d they do today. Oil supply from non-conventional oil (tar sands, shale oil, etc.) will grow but still be a relatively small amount when compared to conventional oil sources. Global demand for oil is projected to be around 103 Mb/d in 2030. Conventional oil supply is expected to meet the vast majority of this demand. What is not clear is where the oil will come from. The expectation seems to be that Iran, Iraq, Russia, and Saudi Arabia will be pumping a lot more oil in 2030 than they do today.
CO2 emissions, however, continue to rise.

BP's projections are in the mid range of most publicly available energy demand forecasts. For 2030, the IEA is projecting global oil demand around 100 Mb/d, the US EIA is projecting oil demand around 111 Mb/d and my own projections are for global oil demand around 117 Mb/d.
Tuesday, 29 November 2011
Renewable Energy Base Increases in 2010
In 2010, there where some big increases in the usage of renewable energy to generate electricity. Between 2009 and 2010, solar base increased 70% while wind base increased 24%. Asia experienced the biggest increase in renewable energy projects.

Saturday, 12 November 2011
A Shakeout in the Solar Industry
Thanks to Tej Kumar for sending me these two interesting stories (here and here) about how the solar industry is going through major restructuring. One challenge facing solar makers is that the price of polysilicone (a key ingredient in the manufacturer of solar panels) has fallen dramatically since 2008. The low price of polysilicone is knocking smaller less competitive companies out of the market place. Polysilicon accounts for one quarter of the cost of a finished solar panel (see here). While lower prices are good for consumers and should help to spur wider adoption of solar power, low prices eat into profit margins and this puts pressure on companies to find ways to increase competitive advantage. For large well organized companies, reducing costs might be enough. Sunpower, a large US company that we study in week 3 of BSUS 6600 is looking to cut next years operating costs by 10%. First Solar, the other big US solar company is looking for ways to consolidate its manufacturing. For other companies, vertical integration or horizontal integration are obvious choices to remaining in business. For some companies, survival through M&A activity may be the only option. Lower prices for polysilicone also puts pressure on governments to reduce or eliminate generous feed in tariffs. Germany and Spain have already cut subsidies for solar power and Ontario is currently reviewing its micro FIT program. On top of this, the euro debt crisis is slowing solar panel installation in Europe.

The impact on the share prices of publicly traded solar companies has been a disaster. Over the past 6 months, for example, a basket of solar stocks (in blue, grey is the S&P 500) has lost 50% of its value.

The impact on the share prices of publicly traded solar companies has been a disaster. Over the past 6 months, for example, a basket of solar stocks (in blue, grey is the S&P 500) has lost 50% of its value.
Sunday, 2 October 2011
Negative Electricity Prices in Germany
For BSUS 6600 students, here and here are interesting stories on how Germany's push for more renewable energy is actually generating negative electricity prices. Renewable energy gets priority access to the grid, so on days when the wind blows and the sun shines fossil fuel powered plants are stopped from running at full capacity to make way for the electricity being generated with renewables.
"The 15 mile-per-hour winds that buffeted northern Germany on July 24 caused the nation’s 21,600 windmills to generate so much power that utilities such as EON AG and RWE AG (RWE) had to pay consumers to take it off the grid."
"The 15 mile-per-hour winds that buffeted northern Germany on July 24 caused the nation’s 21,600 windmills to generate so much power that utilities such as EON AG and RWE AG (RWE) had to pay consumers to take it off the grid."
Wednesday, 21 September 2011
NRG: The Future of a Utility
On a recent edition of Mad Money, Jim Cramer talked with David Crane who is the CEO of NRG. NRG is a utility company with a market cap of $5.4 billion, a beta value of 0.76 and a forward p/e ratio of 23.8. This company has an interesting renewable energy portfolio.
Monday, 22 August 2011
Renewable Energy Breakthroughs
Here are two really cool recent breakthroughs in renewable energy.
MIT researchers have found a way to print solar panels onto a piece of paper. They can even be folded and reused! Check out the video!
Chinese researchers have developed a fuel cell that can clean water as it generates electricity.
MIT researchers have found a way to print solar panels onto a piece of paper. They can even be folded and reused! Check out the video!
Chinese researchers have developed a fuel cell that can clean water as it generates electricity.
Saturday, 9 July 2011
Corn, Ethanol and $6 Billion
Sunday, 3 July 2011
Solar lights the way in rural India
Here is a nice example of economic leapfrogging. With 300 million Indians without electricity and long waits for a grid connection, people are turning to solar.
Subscribe to:
Posts (Atom)