I recently gave an interview to 360 Energy about the newly announced plan to start a cap and trade
program for carbon dioxide trading in Ontario.
Here is the link to the interview.
In the interview I cover some of the pros and cons of carbon trading and provide some thoughts on other carbon related topics.
Showing posts with label sustainability. Show all posts
Showing posts with label sustainability. Show all posts
Thursday, 21 May 2015
Friday, 19 April 2013
What Google Trends is Saying About Renewable Energy and Fracking
Google searches of the term "renewable energy" peaked in March of 2009. Since then, Google searches for renewable energy having been trending downwards. In comparison, searches of the term "fracking" really started to take off in late 2010 and hit a record high in February of this year.
Here is a regional map of searches for renewable energy. Searchers in Europe, Africa, India, and Australia have shown strong interest in renewable energy. Here is a regional map of searches for fracking. Notice how much search interest there is in this term coming from the US and South Africa.
Here is a regional map of searches for renewable energy. Searchers in Europe, Africa, India, and Australia have shown strong interest in renewable energy. Here is a regional map of searches for fracking. Notice how much search interest there is in this term coming from the US and South Africa.
Sunday, 10 June 2012
Sustainable Investing vs Wine and Gold
What do sustainable investments, wine and gold have in common over the past ten years? Well, for one thing, investments in wine and gold have vastly outperformed an investment in sustainable companies.Below is a chart showing the performance of wine (measured by the Live Ex Fine Wine 100 Index), sustainable equities (as measured by the Dow Jones Sustainability Index), gold (the front month futures contract on COMEX gold), and the S&P500.
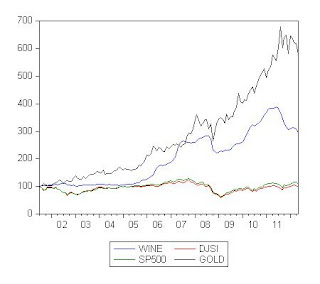
Sharpe ratios show that wine has been the best investment followed closely by gold. The S&P 500 has a slightly larger Sharpe ratio then the Dow Jones Sustainability Index, but both Sharpe ratios are negative over the sample period.
To combine the concepts of sustainability and wine together, how about a sustainability wine index? An example of this would be an index that follows organic wines.

Sharpe ratios show that wine has been the best investment followed closely by gold. The S&P 500 has a slightly larger Sharpe ratio then the Dow Jones Sustainability Index, but both Sharpe ratios are negative over the sample period.
| wine | djsi | sp500 | gold | ||
| 0.79 | -0.12 | -0.06 | 0.78 |
Tuesday, 5 June 2012
How Green is Boston?
This week I am making my travel arrangements for the Academy of Management Meetings in Boston. Whenever I travel to a major city I like to have an idea of how green the city is. The Economist Intelligence Unit in sponsorship with Siemens has created the US and Canada Green City Index. In constructing this index, 27 Canadian and US cities are ranked on categories like CO2 emissions, energy use, land use, buildings, transport, water usage, waste, air pollution and environmental governance. Boston ranks 6 on the Green City Index (higher than the city where I work, Toronto). Boston is the greenest city that the AOM has been to in many years. San Fransisco ranks as the greenest city while Detroit ranks 27 th.

The Green City Index is based on a city's ranking in several categories. Boston's ranking in the categories are: CO2 emissions (11), energy use (2), land use (4), buildings (10), transport (17), water usage (2), waste (15), air pollution (14), and environmental governance (15). Boston does particular well in the categories of energy use, land use and water use. Boston's low carbon dioxide emissions are helped by consuming less energy and using less coal in electricity generation. Boston also has a comprehensive plan for energy conservation initiatives and the Solar Boston project which aims to encourage wide-spread adoption of solar energy. At just 74 gallons of water per person per day, Boston has the second lowest level of water consumption of the cities ranked (New York has the lowest water consumption). Boston is a high density city which gives it a high ranking on the land use scale.
Green buildings, transport and air pollution are areas where Boston could do better. Boston has 6.5 buildings per 100,000 people that are LEED certified. This is about average. Boston has a relatively high rate of non-automobile commuting but the city's public transport options are limited. More public transport in more places would help to improve Boston's transportation ranking. Boston could also improve on recycling, especially the recycling of hazardous material. Boston's low ranking on environmental governance has to do with the fact that there is no coherent action plan for green initiatives but rather a series of advisory plans.
Subscribe to:
Posts (Atom)