The Canadian International Council has recently released a new report entitled “Nine Habits of Highly Effective Resource Economies.” (
see here for the report). According to the report, Canada is flush with valuable natural resources but lacks the capabilities and foresight to exploit these natural resources in a sustained value enhancing manner that will create long term growth and prosperity for Canadians. Canada's exploitation of natural resources can be nicely categorized as "rip and ship".
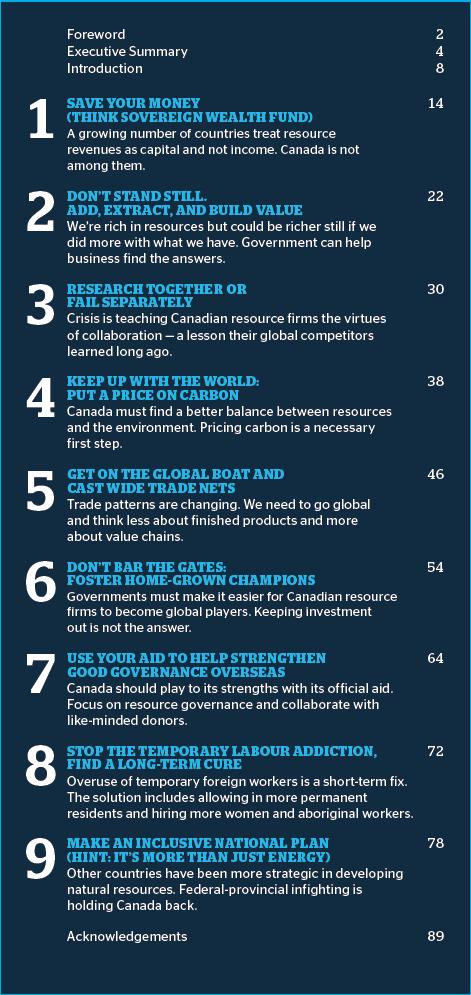
The details of the nine habits are in the report, but here is a listing of the nine habits.
Foreign ownership of Canada's natural resources is one area that is particularly worrisome. In general, Canadian natural resource companies grow to a reasonably large size and, rather than striving to become global leaders, choose instead to sell out to a foreign competitor. A recent example of the sell to foreigners approach is China’s state-owned CNOOC Ltd.$15-billion bid for Calgary-based oil producer Nexen Inc.
For a country that has a lot of natural resources, Canadian resource companies are not prominently listed among the world's biggest resource companies. Canada is the world’s top producer of potash and titanium
and ranks among the top 10 producers of forest products, uranium, aluminum,
natural gas, sulphur, tungsten, diamonds, asbestos, nickel, platinum, crude
oil, molybdenum, zinc, and gold. With such an impressive production record, one would expect Canadian natural resource companies to rank among the biggest in the world. Potash is the world's largest potash company, but most Canadian resource companies do not rank among the global giants.
Foreign ownership is particularly evident in the Alberta tar sands where by some estimates more than two-thirds of all tar sands production in Canada is owned by foreign entities (
see here). This sends a majority of the profits from oil produced from the tar sands outside of Canada. So, Canada needs a different approach if it is going to benefit from its natural resource wealth.
A sovereign wealth fund (SWF) is one approach that Canada can expand upon.
After all, Alberta has the Heritage Fund, so why not create a natural resource based sovereign wealth
fund for Canada as a whole.
Here is a ranking of the world's top sovereign wealth funds. The Alberta Heritage Fund ranks 29th. Notice that Alberta's fund was started in 1976, the same year that Alaska started theirs. The Alaska fund is, however, 3 times larger than Alberta's. Australia started their fund in 2006, and look at how much money it already has. When compared against other SWFs, the Alberta Heritage Fund doesn't seem to be doing so well. A recent
Toronto Star article on Norway points out that at least from Norway's perspective, Canada is a nice place with lots of natural resources, but badly managed.
Data sourced from
Sovereign Wealth Fund Institute
The current situation in Canada can be described as too much foreign ownership and too low of a tax base for Canada to effectively generate wealth from its natural resources. This makes Canadian natural resources vulnerable to international rent seekers.
So what is Norway doing so well?
Norway's SWF was setup in 1990 and currently has slightly over $650 billion dollars. The fund is on track to amass $1 trillion by the end of this decade. The fund is an excellent case study on portfolio investing (
see here). Norway faced foreign ownership problems in the oil business as well but they responded with a 90% marginal tax and focused on training their own citizens to be the primary source of employment in the oil and gas sector. In comparison, Alberta has a miniscule 10% royalty tax and companies working in Alberta outsource as much capital and labour as they can with the predictable result that Alberta is earning a fraction of what it should be from its valuable natural resource base. Norway is also not afraid of starring down carbon nay-Sayers. Norway recently announced that it would
increase its current carbon tax on offshore oil companies by £21 to £45 per tonne of carbon. Norway also has a carbon tax imposed on the fishing industry.
Perhaps Canada needs to re-think the concept of a state owned oil company.


