Showing posts with label monetary policy. Show all posts

Friday, 1 April 2016

Predicting US Recessions Using the Yield Curve


In last week’s Economic Forecasting and Analysis class, we talked about how the yield curve could be used to predict economic recessions. There is a deep literature on this topic going back to the late 1980s. The basic idea is that the market for government bonds is very sensitive to monetary policy. Normally, the yield curve is upward sloping, the difference between yields of long bonds (say 10 years) and short bonds (3 month T bills) is positive to compensate investors for the additional risk in holding bonds for longer periods of  time. In recessions, central banks cut benchmark interest rates in order to stimulate the economy. A reduction in interest rates lowers the yield on new issues of government bonds. Consequently, if the bond market expects a recession and a cut in central bank rates, bond investors will start selling short term bonds and buy long term bonds to lock in the higher yields. This pushes the price of long bonds up and reduces the price of short bonds. Since bond prices and yields are inversely related, short yields rise and long yields fall. The yield curve inverts when the yield spread becomes negative.

The Federal Reserve Bank of New York has been actively studying this topic for a long time, and there is lots of useful information posted on their website. The existing literature shows that the yield spread is a good predictor of recessions one year into the future.  The New York Fed posts data on the NBER dating of US recessions and the yield spread and uses this data to estimate the probability of a US recession using a probit model. The dependent variable is a binary variable equal to one if the economy is currently in a recession and zero otherwise. The independent variable is a 12 month lag of the yield spread. The New York Fed posts the data, model results, and recession probability chart but this is still a worthy exercise to work through. For estimation in R, I have loaded the data into a csv file with the spread variable lagged 12 months.

Here is the probit regression output. 

Deviance Residuals: 
    Min       1Q   Median       3Q      Max  
-2.4163  -0.5152  -0.2630  -0.1147   2.8313  

Coefficients:
            Estimate Std. Error z value Pr(>|z|)    
(Intercept) -0.54086    0.08047  -6.721  1.8e-11 ***
Spread      -0.65560    0.06702  -9.782  < 2e-16 ***
---
Signif. codes:  
0 ‘***’ 0.001 ‘**’ 0.01 ‘*’ 0.05 ‘.’ 0.1 ‘ ’ 1

(Dispersion parameter for binomial family taken to be 1)

    Null deviance: 540.93  on 673  degrees of freedom
Residual deviance: 398.29  on 672  degrees of freedom
AIC: 402.29

Number of Fisher Scoring iterations: 6

The estimated parameter values are close but not identical to the ones from the New York Fed (intercept = -0.5330, slope = -0.6330. Different estimation procedures for probit may be the result of the minor differences in results.

Here is the probability of US recession chart.
Probabilities over 40% seem to be accurate predictors of future recessions.

The probit estimates can be used to predict the probability of a US recession. The following table shows the probabilities for the next 12 months. The probability of a US recession 12 months from now is currently very low at 6.6%.

      recession prob 2016/2017
March     0.03154117         3
April     0.03596135         4
May       0.02441563         5
June      0.01899524         6
July      0.02056696         7
Aug       0.02757996         8
Sept      0.02556458         9
Oct       0.02972609        10
Nov       0.02595748        11
Dec       0.03154117        12
Jan       0.04087655         1
Feb       0.06621488         2


The R script is posted below.

#########################################################
#  Economic forecasting and analysis
#  April 2016
#  Perry Sadorsky
#  Predicting US Recessions Using the Yield Curve
##########################################################


# model and data from:
# https://www.newyorkfed.org/research/capital_markets/ycfaq.html


Book1 <- read.csv("C:/recessions/Book1.csv")
View(Book1)


mydata = ts(Book1, start=1960, freq =12)

myprobit <- glm(NBER_Rec ~ Spread, family=binomial(link="probit"), data=mydata)
summary(myprobit)

prob_in = predict(myprobit,
        type = "response")

plot(prob_in)

df1 = cbind(mydata[,"Spread"], prob_in)
plot(df1[,2], main="Probability of US recession", ylab="", xlab="")


newdata = data.frame(Spread = c(2.01,
           1.92,
           2.18,
           2.34,
           2.29,
           2.10,
           2.15,
           2.05,
           2.14,
           2.01,
           1.83,
           1.47
              
))


prob_out = predict(myprobit, newdata,
        type = "response")

prob_out

prob_out_t = cbind(prob_out,c(seq(from = 3,to = 12, by=1),1,2))
colnames(prob_out_t)=c("recession prob", "2016/2017")

prob_out_t
rownames(prob_out_t) = c("March", "April","May", "June", "July","Aug", "Sept","Oct", "Nov", "Dec","Jan", "Feb" )
prob_out_t


Thursday, 17 May 2012

Low inflation expectations

Latest information from the Cleveland Federal Reserve on inflationary expectations indicates inflation is expected to be below 2% over the next 10 years. Really low inflation combined with even lower nominal interest rates spells negative real interest rates. In other words, fixed income investors are screwed.


Central banks around the world have an incentive to keep interest rates low in order to make it cheaper to service their debt. Massive printing of money to service debt should increase inflation in the long-run (due to the quantity theory of money) but apparently this is not happening. There is lots more room for fiscal stimulus. Go ahead central governments, spend, spend and spend some more.

Tuesday, 8 May 2012

Doom to the Euro


The next time I teach a class on monetary union or international finance, I will be sure to show this graph from the Atlantic.

"Here is what this chart shows. Compared across more than 100 factors measured by the World Economic Forum Global Competitiveness Report, from corruption to deficits, JP Morgan analyst Michael Cembalest calculates that the major countries on the euro are more different from each other than basically every random grab bag of nations there is, including: the make-believe reconstituted Ottoman Empire; all the English speaking Eastern and Southern African countries; and all countries on Earth at the 5th parallel north."

No argument from me. Keeping the Euro currency afloat with this many dissimilar countries is like forcing square pegs into round holes.


Saturday, 17 December 2011

M2 to Gold and Inflation

By most conventional measures of inflation, like the CPI, inflation does not appear to be too great of a problem for developed economies. For the US, inflation is running at 3.5% per year while for Canada it is 2.9% per year. The Canadian inflation rate is near the upper band of the Bank of Canada's target rate of 3% but so far, there is no strong indication from the Bank of Canada that it will raise interest rates in the near future. Inflation rates in China and Britain are slightly higher than 4% per year while Japan is experiencing deflation.


Another measure of inflation is to compare the M2 money supply with gold prices. The chart below shows this ratio for the US. The money supply is measured in billions of dollars and gold is measured in dollars per ounce which means that the vertical axis is measured in billions of ounces of gold. By this measure, inflation is a much bigger problem and more closely resembles what happened in the 1970s. Notice also, that the M2 to gold price ratio is indicative of equity performance. During the long bull run in equities (1980-2000) the ratio was rising. Since 2000, however, the ratio has been falling indicating a drop in the real value of money. Today's $9.6 trillion dollars of US M2 only buys 5.5 billion ounces of gold. Stocks do not do well in inflationary environments.

One other point. The calculation of US CPI is somewhat controversial (especially with respect to substitutes and hedonics). In the 1980s and 1990s, changes were made to the way that the CPI was calculated. If the original method of calculating the CPI is used, then current US inflation is running above 10%.


Sunday, 27 November 2011

China's Foreign Exchange Reserves

Due to strong exports and foreign investment into China, China has been piling up an enormous amount of foreign exchange reserves (currency, gold and special drawing rights with the IMF). Approximately 2/3 of these reserves are in US dollar assets (US treasury bills, US treasury bonds). A linear regression model indicates that China is accumulating an average of $33 billion per month.At the end of September 2011, China held $3.2 trillion in foreign exchange reserves.


Tuesday, 22 November 2011

Investing in 5 Year US Government Bonds

With so much uncertainty affecting global financial markets, it is difficult to find good investment opportunities. The response has been a flight to safety. If you cannot make money at least try to preserve what you have. In the recent 5 year government bond auction the yield fell below 1% for the first time ever. With these record low yields, negative returns are becoming the norm.

Swiss Monetary Base

In a recent post I presented a chart showing how the US monetary base has been increasing dramatically. Under normal situations, an increase in monetary base expands broader money supply measures like M2  because of fractional reserve banking. If banks hoard the money and don't loan it out, then increases in the monetary base have little impact on the broader money supply measures. In other words, the money is not getting into the hands of consumers and businesses. Now, the Swiss central bank is doing the same thing.
Well, at least there is no fear of inflation.

Saturday, 19 November 2011

On Goldman Sachs

Here are two interesting posts about Goldman Sachs. First, it is harder to get into GS than it is to get into Harvard. 300,000 people applied to GS in the past 2 years and only 4% were hired. Harvard's acceptance rate is 6.2%. Second, with the appointment of Mario Monto as Italy's new Prime Minister GS may be ready to take over the world.

Be Fed Chairman for a Day

The San Francisco Fed has a neat interactive game that tests your ability to be a Fed Chairman. Try running the model with a low federal funds rate (which the Fed has been doing over the past few years).

Sunday, 6 November 2011

US Money Supply and Bank Excessive Reserves

For ECON 2000 students, here is a graph showing how US M2 has responded to an increase in base money.


 Here is a graph showing excess reserves at banks.

QE2 and Foreign Banks

Here and here are interesting posts about where the money from QE2 went. Much of the QE2 money went to foreign banks, which is not too surprising, given the way the Fed operates.


Wednesday, 10 August 2011

Fiscal Stimulus but No More Monetary Stimulus

Professor Joseph Stiglitz suggests the US needs more fiscal stimulus but no more monetary stimulus. Failed monetary policy helped to create the current economic crisis.

Tuesday, 19 July 2011

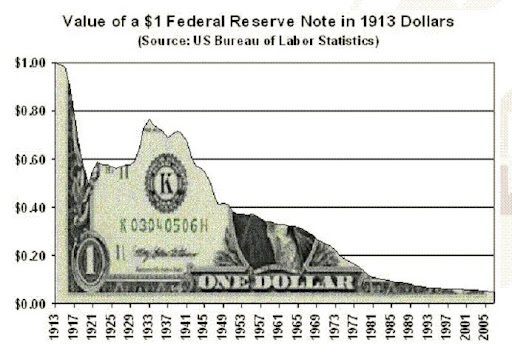
Printing Money and the Value of $1 in 1913 Dollars

Washington's Blog has a nice article on comments Ron Paul made about US debt and how printing money reduces purchasing power. Inflation erodes the real value of investments.Here is an example. In 1913 when the Federal Reserve Central Bank was established,  gold was valued at $20.67 per ounce. Today, in paper fiat units,  gold is valued at around $1,500 per ounce.  So if we divide $20.67 by $1,500, we get 0.01378 minus 1 = – 0.9862 X 100 = – 98.6 percent. This calculation shows that since 1913, US fiat money has lost 98.6% of its value since 1913.

This chart in particle caught my eye.

Thursday, 14 July 2011

Forget About QE3, Its All About Fiscal Policy

Here is something that I have being saying for sometime now. When interest rates get close to zero,
the economy enters a liquidity trap (see here). Nominal interest rates can not go below zero, so the main instrument of monetary policy to stimulate the economy (lowering interest rates) goes out of the window. In the IS-LM framework, the economy is stuck near zero on the y (interest rate) axis. Try the analysis for yourself.

James Galbraith takes the view that QE3 is likely to have no measurable impact on the US economy (see here). If monetary policy becomes ineffective, then that leaves fiscal policy as the only option.