Below is a link to a good video showing how the US is moving forward with renewable energy. Here are some of the highlights.
A combination of federal and state rebates and tax incentives are providing strong incentives to adopt renewable energy. In Washington State, for example, home owners who install solar panels can expect a payback period of between 5 and 7 years.
Jobs in the US solar industry increased 13% last year, compared to just 2% for the overall economy.
In Texas, 1/4 of all electricity produced comes from wind farms.
The US outspends Canada 18 to 1 on per capita spending on clean tech.
The video also features Itek, a US solar manufacturer run by a Canadian.
Thursday, 21 February 2013
Friday, 8 February 2013
Renewable Energy Moving Forward
The Pew Charitable Trusts recently published a research report on the state of renewable energy. They are predicting that global revenue from the installation of renewable energy
technologies would grow at a
compound annual rate of eight per cent from $200bn in 2012 to $327bn by
2018. This would create cumulative revenue of $1.9tr. The compound annual rate of 8% is consistent with other projections (eg. IEA). In general, most analysis shows that renewable energy usage is the fastest growing component of the energy mix.
The Pew report points out that while there are tremendous opportunities for countries to profit from this trend in renewable energy investment, countries without a well formulated energy policy are likely to lose out. The report highlights the case in the US but this equally applies to Canada. There are 118 countries with renewable energy targets. Unfortunately, neither Canada or the US is among them.
Here are a few interesting figures from the Pew report showing that G20 countries are leading the way in clean energy investment and how the cost of solar energy modules has fallen dramatically.


In order to get an idea of how renewable energy depends upon income and CO2 emissions, I gathered some data on world energy consumption, CO2 emissions, GDP, and renewable energy production from the World Bank on line database.Renewable energy includes biomass, wood waste, geothermal, solar, wind, tide, wave, etc. but excludes hydroelectric power.
The units for my variables are:
energy is measured in millions of kt of oil equivalent
renewable energy is measured as electricity production from renewable sources, excluding hydroelectric (billions of kWh)
CO2 is measured in millions of kt of carbon dioxide emissions
GDP is measured in trillions of 2005 international dollars
Looking at year over year % changes indicates that energy use, GDP, and CO2 emissions track each other very closely. Notice that renewable energy tends to have much greater fluctuations.

Here is how renewable energy correlates with CO2 emissions. Both variables are measured in natural logarithms.
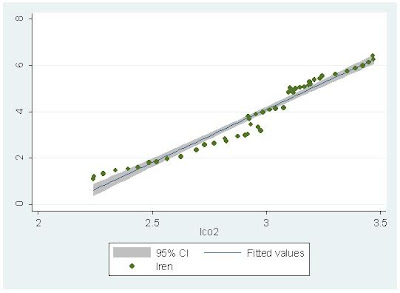
Along the best fit line, a 1% increase in CO2 emissions is associated with a 4.59% increase in renewable energy.
Here is how renewable energy correlates with GDP. Both variables are measured in natural logarithms.

Along the best fit line, a 1% increase in GDP is associated with a 2.99% increase in renewable energy. The high income elasticity is consistent with some of my previous research on renewable energy consumption in developed and emerging economies (here, here).
By comparison, a 1% increase in GDP is associated with a 0.58% increase in total energy consumption.

As the world economy rebounds from the Great Recession, economic activity will increase and GDP will increase. Increases in GDP have a bigger impact on renewable energy consumption than total energy consumption, so expect to see further increases in renewable energy in the future. Unfortunately, without a reasonable energy policy, Canada and the US will be left on the sidelines as other countries capture competitive advantage in the renewable energy sector.
Subscribe to:
Posts (Atom)