Statistics Canada recently released the results of a new study comparing productivity in Canada and the US.
"The productivity of the unincorporated sector relative to the corporate sector is much lower in Canada than in the United States. As a result, when the unincorporated sector is removed from the estimates for the business sector of each country and only the corporate sectors for the two countries are compared, differences between Canada and the United States are much lower.
The Canada–United States ratio for labour productivity in the business sector as a whole was 88.0% in 1998 while the productivity ratio for the corporate sector (after removing unincorporated businesses) was much higher, at 99.2%. From 1998 to 2005, the level of productivity of the unincorporated sector in Canada relative to the unincorporated sector in the United States remained about the same; however, the relative productivity of the corporate sector fell. By 2005, the overall Canada–United States ratio for the business sector had declined to 81%, and the productivity ratio for the corporate sector fell to 89%."
My take away from this is that 1) yes, Canada has a large number of small unincorporated businesses that are less productive than their counterparts in the US but the productivity ratio for unincorporated businesses between Canada and the US remained the same over the period 1988 to 2005, and 2) productivity in the Canadian corporate sector has fallen a lot (relative to the US) over the period 1988 to 2005. Falling productivity in the corporate sector is not good for economic wealth creation in Canada. So, what is going on? Here are two possible explanations.
1. Corporations are not stressing the importance of productivity enough. The Canadian dollar was relatively weak over the period studied and the weak Canadian dollar may have been viewed as a competitive advantage that distracted away from productivity improvements.
2. Highly productive workers are not being paid real wages equal to their marginal productivity. In this case, there is not much point for a worker to be more productive if he or she is not being appropriately compensated.
Sunday, 31 July 2011
Saturday, 30 July 2011
Sector Rotation for July 31, 2011
| Canadian size portfolios |
| iShares S&P/TSX 60 Index (XIU.TO) |
| iShares S&P/TSX Completion Index (XMD.TO) |
| iShares S&P/TSX SmallCap Index (XCS.TO) |
| Canadian industry sectors |
| iShares S&P/TSX Capped REIT Index (XRE.TO) |
| iShares S&P/TSX Capped Energy Index (XEG.TO) |
| iShares S&P/TSX Global Gold Index (XGD.TO) |
| iShares S&P/TSX Capped Financials Index (XFN.TO) |
| iShares S&P/TSX Capped Info Tech Index (XIT.TO) |
| iShares S&P/TSX Capped Materials Index (XMA.TO) |
| International portfolios |
| iShares S&P 500 Index C$-Hedged (XSP.TO) |
| iShares MSCI EAFE Index C$-Hedged (XIN.TO) |
| iShares MSCI Emerging Markets Idx (XEM.TO) |
| Claymore BRIC (CBQ.TO) |
| Commodities |
| iSHARES GOLD TRUST (IGT.TO) |
| Ticker | XCS | XEM | IGT | XEG | XFN | XGD | XIT |
| Rank | 6 | 9 | 1 | 12 | 11 | 8 | 14 |
| Above ma(10)? | No | No | Yes | No | No | No | No |
| Ticker | XMA | XRE | XIU | XMD | XSP | XIN | CBQ |
| Rank | 5 | 2 | 10 | 3 | 4 | 13 | 7 |
| Above ma(10)? | No | Yes | No | No | Yes | No | No |
Wednesday, 27 July 2011
Here is What Happens if there is no Deal on the US Debt Ceiling
According to David Walker -- the former Comptroller General of the United States and head of the Government Accountability Office, here is what happens if the federal government cannot reach a deal.
1. $4 billion-plus a day will come out of the economy.
2. Government and civilian military workers will be laid off temporarily. That will result in penalties for late payment, to be paid by taxpayers.
3. Social security payments will be delayed.
4. No one knows how bad the reaction will be, but Walker is confident it will be negative for the stock and bond markets and the economy.
5. Interest rates will rise. For every 1% rise in interest rates, taxpayers will be on the hook for an additional $150 billion in debt payments.
The Effect of A US Downgrade On Stocks
For those of you trying to figure out what the effect of a US debt downgrade would mean for stocks, here is a calculation from Contrarian Musings showing that a debt down grade would lead to a 6.5% drop in US stocks. Intrade Prediction Markets indicates that there is currently a 60% chance that Standard and Poor's will downgrade US debt from its current triple A rating.
Monday, 25 July 2011
Forget About Cost Cutting: RIM Needs to Increase Sales
Research in Motion (RIM) announced that it is cutting 2,000 jobs. Job cuts are cost cutting measures and even in the best of times, job cuts are disruptive. Cost cutting is operational. RIM needs to think strategically. What RIM needs to do is stop worrying about cutting costs and instead focus on increasing sales.RIM needs to role out its new operating system and get some cool new products in the stores for the fall.


Here is Who Owns the $14 Trillion US Debt
While Washington is bogged down in how to raise the US debt ceiling, people around the world are asking questions like "who owns this debt?". The Atlantic has a graph answering this question. More than half of the total national debt is owed to the US Federal Reserve. Debt owed to a country's own citizens is not as big a problem as debt owed to foreigners.


Saturday, 23 July 2011
More Aid to Greece
The BBC has a good story summarizing what is known about the latest aid package to Greece. The story also has a link to the original EU press release which is a short 4 page document short on specifics.
According to the BBC story:
"Debt relief
The Institute of International Finance - a global trade body representing big banks and other major lenders - said the planned debt restructuring would target participation by 90% of Greece's private sector lenders.
French President Nicolas Sarkozy said private lenders will contribute a total of 135bn euros of financing to Greece.
The plan is expected to provide some 50bn euros of debt relief to Greece.
Three of the four options offered to lenders to swap or relend existing debts would extend Greece's repayment terms by 30 years, while the fourth would do so by 15 years.
They all offer a much lower interest rate than Greece's current 15%-25% cost of borrowing in financial markets.
Two of the options would also involve "haircuts" - reducing the principal amount of debt Greece has to repay.
The terms of the deal imply a loss to Greece's lenders equivalent to 21% of the market value of their debts, said the IIF."
This sounds like a short-run band aid solution to buy some time before a new round of financing is required. The voluntary target participation by 90% of Greece's private sector lenders is a way to stop credit default swap (CDS) payouts. Which brings up an interesting question. What then is the point of purchasing CDS if payouts can be voluntarily suspended?
While the aid package is designed to soften the blow of Greece's current debt situation, it is unlikely that the austerity measures imposed in Greece are going to do anything except plunge the economy into a deep and long recession (see here). In Greece, tax collection is too low (or too lax, since tax evasion is prominent) relative to government spending. Realistically, the EU needs to consider the option of allowing Greece to default on their debt obligations and a possible strategy for allowing Greece to exit the Euro.
Spiegel Online International has really good coverage of the European debt crisis.
Wednesday, 20 July 2011
Gold and the Swiss Franc in Times of Trouble
A good chart from the Economist showing gold and the Swiss Franc in real terms. The Swiss Franc has reached a high in real terms while gold is still slightly below its all time high in real terms. In looking to design a diversified portfolio, it might be interesting to see how adding gold, the Swiss Franc and agriculture commodities to equities and bonds would affect portfolio risk and return.


Tuesday, 19 July 2011
Are Shale Gas Plays Just Ponzi Schemes?
Here is an interesting read on shale gas in the US.
“The word in the world of independents is that the shale plays are just giant Ponzi schemes and the economics just do not work,” an analyst from IHS Drilling Data, an energy research company, wrote in an e-mail on Aug. 28, 2009.
“The word in the world of independents is that the shale plays are just giant Ponzi schemes and the economics just do not work,” an analyst from IHS Drilling Data, an energy research company, wrote in an e-mail on Aug. 28, 2009.
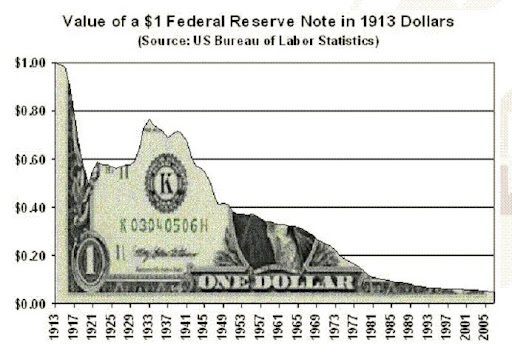
Printing Money and the Value of $1 in 1913 Dollars
Washington's Blog has a nice article on comments Ron Paul made about US debt and how printing money reduces purchasing power. Inflation erodes the real value of investments.Here is an example. In 1913 when the Federal Reserve Central Bank was established, gold was valued at $20.67 per ounce. Today, in paper fiat units, gold is valued at around $1,500 per ounce. So if we divide $20.67 by $1,500, we get 0.01378 minus 1 = – 0.9862 X 100 = – 98.6 percent. This calculation shows that since 1913, US fiat money has lost 98.6% of its value since 1913.
This chart in particle caught my eye.
Saturday, 16 July 2011
Copper Prices Ticking Up
Recently, copper prices broke well above the 200 day moving average and this may be a sign of global economic growth picking up. Copper is used in electronics, homes and infrastructure and copper price movements are often viewed by many as an indicator of global economic conditions.
 For example, here is how the relationship between copper prices and emerging stock prices (as measured by VWO) has looked over the past five years. Correlation does not imply causality, but the two data series do track each other fairly closely.


Friday, 15 July 2011
US Equity Valuation Based on GDP Growth
For students of economic forecasting and analysis, here is another way to value US equities using GDP.
Based on this methodology, the SP500 is currently at or slightly above fair value. It is a good idea to compare this methodology with Tobin's Q and Shiller's CAPE, both of which indicate, for June of 2011, substantial over valuations of US equities.

Based on this methodology, the SP500 is currently at or slightly above fair value. It is a good idea to compare this methodology with Tobin's Q and Shiller's CAPE, both of which indicate, for June of 2011, substantial over valuations of US equities.

Thursday, 14 July 2011
Forget About QE3, Its All About Fiscal Policy
Here is something that I have being saying for sometime now. When interest rates get close to zero,
the economy enters a liquidity trap (see here). Nominal interest rates can not go below zero, so the main instrument of monetary policy to stimulate the economy (lowering interest rates) goes out of the window. In the IS-LM framework, the economy is stuck near zero on the y (interest rate) axis. Try the analysis for yourself.
James Galbraith takes the view that QE3 is likely to have no measurable impact on the US economy (see here). If monetary policy becomes ineffective, then that leaves fiscal policy as the only option.
Drivers of Gold Prices
Nomura recently put out a report on on what drives gold's movement.
Their report is titled: "What drives gold?" Some of the important factors include:
Real interest rates, central bank balance sheets, Indian wedding season, and the Aussie dollar.
Here are some interesting charts from the report.
Their report is titled: "What drives gold?" Some of the important factors include:
Real interest rates, central bank balance sheets, Indian wedding season, and the Aussie dollar.
Here are some interesting charts from the report.
US Taxes Over the Past 100 years
There is an interesting study by the Tax Foundation on US taxes over the past 100 years. The link immediately following "Don't take our word for it, though." has a nice slide show.
Tuesday, 12 July 2011
Real GDP Growth Forecasts for July
Here is a table of economic growth forecasts from The Economist.
How the consensus is for Canada to grow slower than the US in 2012 is
beyond me. Notice, that except for Australia and Sweden growth forecasts
for the other countries in 2012 range between1% and 3%. Looking into the future and assuming an average annual growth rate of 2.7% the Canadian economy will double in approximately 27 years.

Sunday, 10 July 2011
Australia's Carbon Tax
Australia is set to tax carbon, or at least the worst polluters. The tax will go into effect on July 1, 2012.
" Australia will force its 500 worst polluters to pay 23 Australian dollars ($25) for every ton of carbon dioxide they emit, with the government promising to compensate households hit with higher power bills under a plan to reduce greenhouse gas emissions unveiled Sunday."
"The government hopes businesses affected by the tax will seek out clean energy alternatives to reduce their bills. The affected companies will have to pay AU$23 per metric ton of carbon, with the price rising 2.5 percent a year until 2015, when the plan will move to a market-based emissions trading scheme."
On a per captia basis, Australia is one of the biggest polluters in the world. Critics of carbon taxation
argue that this is just another tax grab by big government while environmental groups question if the tax goes far enough.
Saturday, 9 July 2011
Corn, Ethanol and $6 Billion
Pension Woes
Mercer released the latest numbers for their Pension Health Index (see here). The ratio of assets to liabilities for a model Canadian pension plan has been continuously below 100 since mid 2002.
The asset mix for Mercer's model pension plan is:
"Asset mix: 42.5% DEX Universe Bond Total Return Index; 25% S&P/TSX Composite; 15% S&P 500 (CAD); 15% MSCI EAFE (CAD); 2.5% DEX 91 day T-Bills"

Poor financial markets might be behind the current low reading of the index, but the real problems started in the early 2000s.
The asset mix for Mercer's model pension plan is:
"Asset mix: 42.5% DEX Universe Bond Total Return Index; 25% S&P/TSX Composite; 15% S&P 500 (CAD); 15% MSCI EAFE (CAD); 2.5% DEX 91 day T-Bills"
Poor financial markets might be behind the current low reading of the index, but the real problems started in the early 2000s.
Friday, 8 July 2011
Carbon Capture and Storage in Canada and Carbon Trading in Quebec
Here are two interesting stories related to carbon finance. These stories will be particularly interesting to BSUS 6600 students. Environment Canada is in the process of putting together new rules that will affect new coal fired power plants.
"The new rules will prohibit construction of new coal-fired power plants unless they incorporate carbon capture and storage (CCS) technology to remove the greenhouse gases and store them underground."
CCS technology is expensive and not that widely used and this may make it more profitable to keep running the old plants and delay construction of new cleaner plants.Currently, the only CCS plants in operation are in Canada (1), US (2), France (1), Algeria (1) Netherlands (1) and Norway (2) (World Coal Association). Across the world, there are slightly over 30 new CCS plants in the planning stages.
Quebec is taking a more market based approach to carbon dioxide emissions by planning to launch a cap-and-trade system in 2013 (see here).
"The program is designed to reduce Quebec's emissions by 20 per cent of 1990 levels by 2020."
I am interested in learning the details of where and how carbon emissions are going to be traded. This sounds like a regional market for carbon and I wonder if these carbon emissions will be allowed to cross-trade in bigger carbon markets like the EU-ETS.
Wednesday, 6 July 2011
Global Housing Price Indicators - June 2011
The Economist has a nice interactive tool that allows users to compare house prices in different countries (see here). Looking at the data for Britain, Canada and the US from 1996Q1 to 2011Q2, clearly shows bubbles in Britain and the US but so far, no sign of a bubble in Canada. Japanese house prices have been steadily declining since 1989.
Toronto home prices (see here) are looking more bubbly.

gettingtechnical.com shows Toronto home prices way above the 24 month moving average

Toronto home prices (see here) are looking more bubbly.
gettingtechnical.com shows Toronto home prices way above the 24 month moving average
Monday, 4 July 2011
Greek Debt Troubles
Well this is interesting. Rolling over debt is not what S&P considers to be enough to address Greece's debt problems.
"A leading credit ratings agency warned Monday that Greece would be considered to be in default if banks rolled over their holdings in the country's debt as proposed by a French plan."
French banks are heavily exposed to Greek debt and are no doubt looking for a quick short-term fix to their problems. French banks hold about $21 billion of Greek sovereign debt, while Germany holds about $23 billion.This is not going to play well with traders of the Euro.
BC's Carbon Tax Now at 5.56 Cents on Every Litre of Gasoline
As of July 1, BC's carbon tax increase adds another 1.11 cents per litre to gasoline prices and another 1.15 cents per cubic metre on natural gas.The carbon tax now totals 5.56 cents on every litre of gasoline. The carbon tax will rise another 1.11 cents to 6.67 cents per litre on July 1, 2012.
The residents of BC seem to be getting along with the carbon tax, unlike the HST which is not going down so well.
The residents of BC seem to be getting along with the carbon tax, unlike the HST which is not going down so well.
Sunday, 3 July 2011
Solar lights the way in rural India
Here is a nice example of economic leapfrogging. With 300 million Indians without electricity and long waits for a grid connection, people are turning to solar.
Saturday, 2 July 2011
The Tightening Relationship Between Global Oil Consumption and Production
At current global oil consumption, there is not much spare oil production left (see here).
"As figures released in BP’s "Statistical Review of World Energy" show, global oil production has struggled to keep up with increased demand recently, particularly from Asia. In China alone consumption has risen by over 4m barrels per day in the past decade, accounting for two-fifths of the global rise. In 2010 consumption exceeded production by over 5m barrels per day for the first year ever, as world oil stocks were run down."
"As figures released in BP’s "Statistical Review of World Energy" show, global oil production has struggled to keep up with increased demand recently, particularly from Asia. In China alone consumption has risen by over 4m barrels per day in the past decade, accounting for two-fifths of the global rise. In 2010 consumption exceeded production by over 5m barrels per day for the first year ever, as world oil stocks were run down."
Friday, 1 July 2011
Two thousand years in one chart - by The Economist
The Economist has a nice chart showing economic output broken down by century. It has
all happened in the 20th and 21 century. In particluar,
"Over 23% of all the goods and services made since 1AD were produced from 2001 to 2010, according to an updated version of Angus Maddison's figures."

all happened in the 20th and 21 century. In particluar,
"Over 23% of all the goods and services made since 1AD were produced from 2001 to 2010, according to an updated version of Angus Maddison's figures."
Sector Rotation for June 30, 2011
At the end of each month, I rank a selection of Canadian ETFs according to their price strength. The ranking is based on a simple average of three month returns, six month returns and twelve month returns.
| Canadian size portfolios | ||||||||||||||||||||||||||||||||||||||||||||||||||||||||
| iShares S&P/TSX 60 Index (XIU.TO) | ||||||||||||||||||||||||||||||||||||||||||||||||||||||||
| iShares S&P/TSX Completion Index (XMD.TO) | ||||||||||||||||||||||||||||||||||||||||||||||||||||||||
| iShares S&P/TSX SmallCap Index (XCS.TO) | ||||||||||||||||||||||||||||||||||||||||||||||||||||||||
| Canadian industry sectors | ||||||||||||||||||||||||||||||||||||||||||||||||||||||||
| iShares S&P/TSX Capped REIT Index (XRE.TO) | ||||||||||||||||||||||||||||||||||||||||||||||||||||||||
| iShares S&P/TSX Capped Energy Index (XEG.TO) | ||||||||||||||||||||||||||||||||||||||||||||||||||||||||
| iShares S&P/TSX Global Gold Index (XGD.TO) | ||||||||||||||||||||||||||||||||||||||||||||||||||||||||
| iShares S&P/TSX Capped Financials Index (XFN.TO) | ||||||||||||||||||||||||||||||||||||||||||||||||||||||||
| iShares S&P/TSX Capped Info Tech Index (XIT.TO) | ||||||||||||||||||||||||||||||||||||||||||||||||||||||||
| iShares S&P/TSX Capped Materials Index (XMA.TO) | ||||||||||||||||||||||||||||||||||||||||||||||||||||||||
| International portfolios | ||||||||||||||||||||||||||||||||||||||||||||||||||||||||
| iShares S&P 500 Index C$-Hedged (XSP.TO) | ||||||||||||||||||||||||||||||||||||||||||||||||||||||||
| iShares MSCI EAFE Index C$-Hedged (XIN.TO) | ||||||||||||||||||||||||||||||||||||||||||||||||||||||||
| iShares MSCI Emerging Markets Idx (XEM.TO) | ||||||||||||||||||||||||||||||||||||||||||||||||||||||||
| Claymore BRIC (CBQ.TO) | ||||||||||||||||||||||||||||||||||||||||||||||||||||||||
| Commodities | ||||||||||||||||||||||||||||||||||||||||||||||||||||||||
iSHARES GOLD TRUST (IGT.TO)
|
Subscribe to:
Posts (Atom)