|
Thursday, 31 May 2012
Gasoline Prices Around the World
Bloomberg has put together a nice slideshow of gasoline prices around the world. I have created a table from the data in the slideshow. The data on gasoline prices were collected between April 2 and April 11 of this year. Premium gasoline was used in order to account for differences in octane. The most expensive gasoline is in Norway ($9.69) while the cheapest gasoline is in Venezuela ($0.09). Canada ranks at #38 ($5.75) below Japan ($7.58) and above the US ($4.19). Compared to other developed economies, gasoline prices in Canada and the US are actually fairly cheap. Bloomberg also calculates something which they call the pain at the pump (the percentage of daily income needed to buy a gallon of gasoline). In Canada, a gallon of gasoline costs just 4% of average daily income. Gasoline consumers in UAE, Kuwait, Saudi Arabia and Venezuela have cheap gasoline and very low pain at the pump. For other countries, the pain at the pump values vary a lot between developed and developing countries.
Thursday, 17 May 2012
Low inflation expectations
Latest information from the Cleveland Federal Reserve on inflationary expectations indicates inflation is expected to be below 2% over the next 10 years. Really low inflation combined with even lower nominal interest rates spells negative real interest rates. In other words, fixed income investors are screwed.


Central banks around the world have an incentive to keep interest rates low in order to make it cheaper to service their debt. Massive printing of money to service debt should increase inflation in the long-run (due to the quantity theory of money) but apparently this is not happening. There is lots more room for fiscal stimulus. Go ahead central governments, spend, spend and spend some more.
Central banks around the world have an incentive to keep interest rates low in order to make it cheaper to service their debt. Massive printing of money to service debt should increase inflation in the long-run (due to the quantity theory of money) but apparently this is not happening. There is lots more room for fiscal stimulus. Go ahead central governments, spend, spend and spend some more.
Tuesday, 8 May 2012
Failing US clean tech policy
A disturbing new report from the Metropolitan Policy Program at Brookings, shows how US federal support for clean tech is expected to drop by 75% between 2009 and 2014. This crash scenario is based on the assumption that 62 clean tech support programs currently in place will expire and nothing will replace them. The the American Recovery and Reinvestment Act of 2009 (ARRA) provided a number of initiatives to support clean tech but these initiatives are now coming to an end. A number of additional tax credits and production support policies for clean tech are also now coming to an end. In addition, the boom in natural gas is also having an impact. Natural gas is the marginal fuel source for power generators. With natural gas prices currently between $2 and $3 MMBTUs there is no incentive to invest in large scale renewable projects like wind. For wind projects to be economically viable, natural gas prices need to be around $6 MMBTUs.

Clean tech is a very difficult market space to invest in and make money. The macro drivers of clean tech include climate change, energy security, resource depletion, new technology and green consumers. Government policy can greatly influence these drivers. Climate change seems to be a difficult concept for Washington to address so an energy security argument might be easier. In 2011, US net petroleum imports equaled 8.4 MMbd. Assuming an oil price of $100 per barrel, US net imports totaled $306 billion dollars in 2011. The US Department of Commerce has some interesting charts on how the oil import bill breaks down by household. Using some of this money spent on imported oil to invest in renewable energy seems like a good way to increase US energy security and reduce the dependence on imported oil. The US needs a coherent federal energy policy to address issues like energy security and renewable energy should be part of such policy.

Clean tech is a very difficult market space to invest in and make money. The macro drivers of clean tech include climate change, energy security, resource depletion, new technology and green consumers. Government policy can greatly influence these drivers. Climate change seems to be a difficult concept for Washington to address so an energy security argument might be easier. In 2011, US net petroleum imports equaled 8.4 MMbd. Assuming an oil price of $100 per barrel, US net imports totaled $306 billion dollars in 2011. The US Department of Commerce has some interesting charts on how the oil import bill breaks down by household. Using some of this money spent on imported oil to invest in renewable energy seems like a good way to increase US energy security and reduce the dependence on imported oil. The US needs a coherent federal energy policy to address issues like energy security and renewable energy should be part of such policy.
Doom to the Euro
"Here is what this chart shows. Compared across more than 100 factors
measured by the World Economic Forum Global Competitiveness Report, from
corruption to deficits, JP Morgan analyst Michael Cembalest calculates
that the major countries on the euro are more different from each other
than basically every random grab bag of nations there is, including: the
make-believe reconstituted Ottoman Empire; all the English speaking
Eastern and Southern African countries; and all countries on Earth at
the 5th parallel north."
No argument from me. Keeping the Euro currency afloat with this many dissimilar countries is like forcing square pegs into round holes.

Monday, 7 May 2012
Stock trading still well below highs
Stock trading, as measured by the turnover ratio, is still well below record highs. The turnover ratio is the total value of shares traded during the period
divided by the average market capitalization for the period. The steep drops in the turnover ratio are particularly evident for the United States (US) and the United Kingdom (UK). In 2010, the UKs turnover ratio stood at 101.9% a value not seen since 2003. The turnover ratio is still trending down.
A lower turnover ratio may be better for buy and hold investors since a lower turnover may reduce volatility. A lower turnover ratio is also a sign of less interest in stock markets. There is some evidence, from the US and the UK, that seasoned older investors, after have being burned by the 2000s, are moving money out of equities and into fixed income. This demographic shift is of concern because as the baby boomers consolidate their wealth in less risky assets, lower turnover ratios may remain below their peak values for many years. Moreover, many younger investors are also wary of investing in equities and prefer to invest in bonds, even as bond yields sit at record lows. If these two trends continue, it may take a long time before we see a big increase in stock trading.
A lower turnover ratio may be better for buy and hold investors since a lower turnover may reduce volatility. A lower turnover ratio is also a sign of less interest in stock markets. There is some evidence, from the US and the UK, that seasoned older investors, after have being burned by the 2000s, are moving money out of equities and into fixed income. This demographic shift is of concern because as the baby boomers consolidate their wealth in less risky assets, lower turnover ratios may remain below their peak values for many years. Moreover, many younger investors are also wary of investing in equities and prefer to invest in bonds, even as bond yields sit at record lows. If these two trends continue, it may take a long time before we see a big increase in stock trading.
Friday, 4 May 2012
Trend following for Canadian REITs
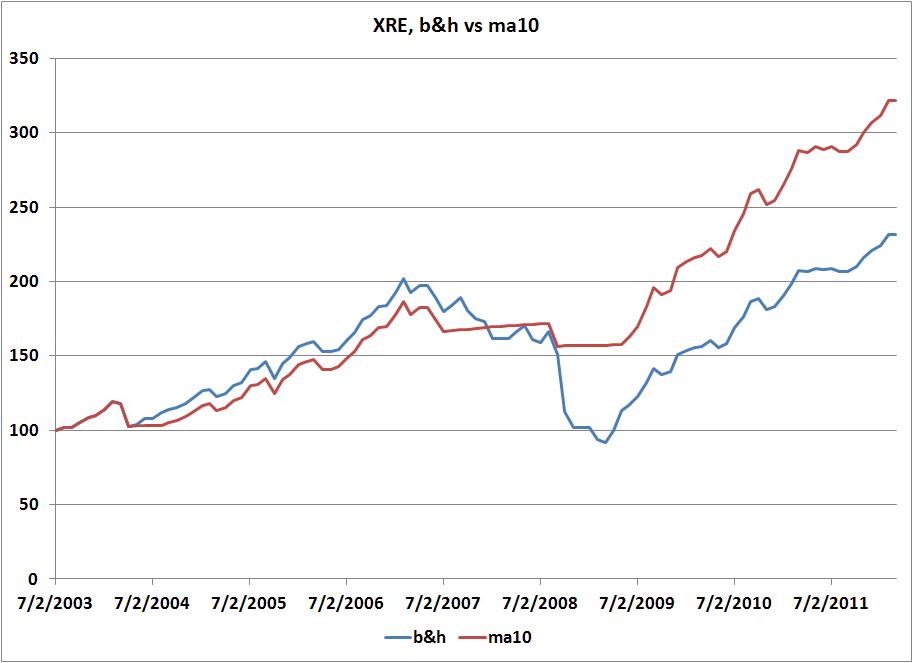
It has been a difficult week for Canadian equities adding to an already sluggish year to date for most equity sectors. The Canadian real estate investment trusts (REITs) sector is the only Canadian equity sector that has been doing well. This sector can be invested in through the XRE ETF. Here is a chart showing how a buy and hold (b&h) strategy of investing in the XRE compares with an investment strategy based on a 10 month moving average. The MA(10) switch portfolio
uses a moving average trend following strategy by comparing monthly
closing prices with a moving average of length ten. Buy or hold the XRE when the monthly close of the XRE is above the 10 month moving average
and sell the XRE and invest in 3 month T bills if the monthly close falls below the 10 month moving average. The chart shows monthly data from July 2003 to March 2012. The moving average trend following strategy outperforms buy and hold.

The risk measures indicate that the moving average trend following strategy outperforms buy and hold. The average annual return for b&h is 11.20% while the average annual return for the trend following strategy is 14.19%. The trend following strategy has a lower standard deviation, higher Sharpe ratio and lower downside risk. Downside risk is calculated relative to a benchmark of 0.
The risk measures indicate that the moving average trend following strategy outperforms buy and hold. The average annual return for b&h is 11.20% while the average annual return for the trend following strategy is 14.19%. The trend following strategy has a lower standard deviation, higher Sharpe ratio and lower downside risk. Downside risk is calculated relative to a benchmark of 0.
| b&h | ma10 | |
| mean | 11.20 | 14.19 |
| stdev | 16.69 | 11.22 |
| sharpe | 0.19 | 0.37 |
| downside | 12.51 | 7.13 |
Subscribe to:
Posts (Atom)